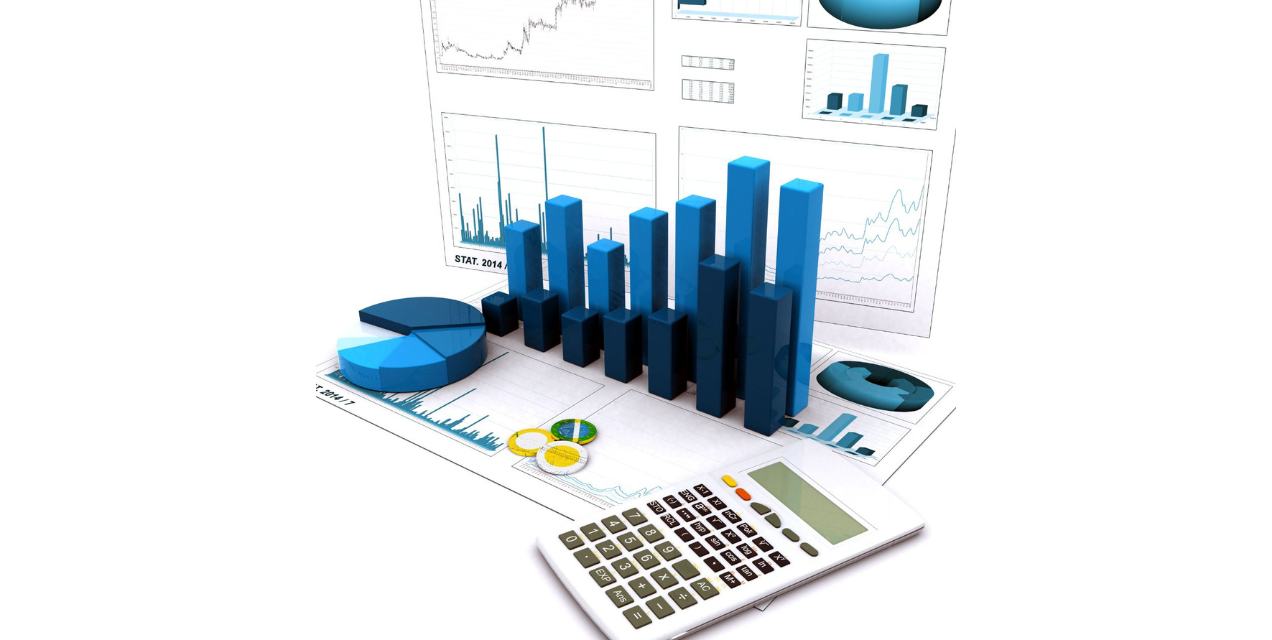
Data Visualisation
We represent information in a visually appealing way.
Data analysis is a process of inspecting, cleansing, transforming, and modeling data with the goal of discovering useful information, suggesting conclusions, and supporting decision-making. It is used in many different industries and fields, from marketing to finance to healthcare, to help businesses and organisations make more informed decisions.
Data analysis is often used in conjunction with data mining, machine learning, and artificial intelligence to uncover patterns and trends that can be used to better understand the data and make better decisions. By understanding the data, businesses can uncover insights that can help them improve their products and services, gain a competitive edge, and increase their revenues.


There are many different types of data analysis, but they can be generally broken down into three types:
Descriptive data analysis uses statistics and other visualisations to summarise and describe data. Predictive data analysis uses statistical modeling to make predictions about future events. Prescriptive data analysis use mathematical optimisation techniques to find the best possible solution to a problem.
Data analysis can help businesses make better decisions, increase revenue, and improve their products and services by uncovering insights. With data analysis, businesses can better understand their customers and make decisions based on data rather than emotion or guesswork.
